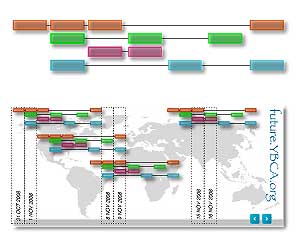
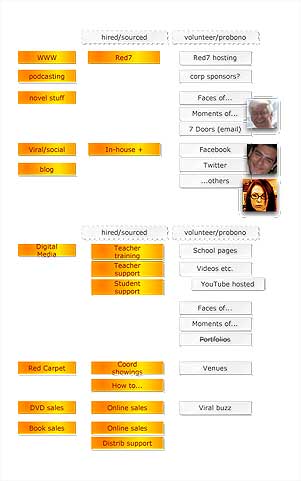
 Jay Cross writes about developing a reputation as the guy who was doodling in business school classes.
But what Jay shows as examples might not all be doodles. Meaning aimless drawing. Yes, Jay may have been doodling much of the time, but there’s often more to it than that. And it can be extremely useful as well.
What I do all the time is use drawings as my meeting notes rather than long paragraphs of verbatim notes. I’m a visual person. I enjoy color and form, and I keep my contact lens prescription up to date so I can see sharply in the distance. I can’t tolerate fuzzy video – even HD is a little bit “soft focus” for me much of the time.
 I “drew” my class notes many times as well. In third grade, my teacher called me out and made me stop cartooning in the margins of my papers. But, I did this in college because my core classes were in math and engineering. In math if we didn’t draw a graph or visual representation at least once during a class we would have been lost (eigenvalues, eigenvectors, calculus, number theory, error analysis, infinite series, and above all statistics). In engineering, a drawing is often the quickest way to communicate a relationship – and easier to comprehend than an equation (or worse yet, a set of simultaneous linear equations). A drawing gives a conceptual overview, and can be followed by formulas and numbers to fill in the details.
I carried that behavior over into all of the rest of my note-taking. A visual has always been the best way for me to hook concepts together into a whole.
With the advent of the digital camera (around 1994 for me) and whole-wall-whiteboards (we had them everywhere I worked after 1994), we’d sketch representations of ideas on the walls during a meeting and then photograph them and email them to the participants, erase the wall and do it again. I also photograph some of my paper notes and distribute them.
 So does that mean I don’t take notes on my computer? Well of course I do! I type really fast, and yet I can’t keep up with the concepts that fly by in a typical meeting. So in a meeting I type a few short notes and website names, and to-do lists, but I frequently have a sheet of paper out there on which I’m jotting down words in a spatial representation, connecting them, clouds drawn around the connected concepts, and lots of boxes and so forth. For the last four years or so, I have also used OmniGraffle for note-taking – it’s a diagramming tool – so I drop textboxes onto the page and drag them around to group and regroup them in real time during the meeting. I join up the related concepts with lines which rearrange themselves when the boxes are dragged. When we finish meeting, I can copy/paste the diagram and send it to everyone.
There is, of course, true doodling. Squiggles. Crosshatches. Shading. Winding lines. Abstract shapes. And although many people doodle during meetings and it probably helps their thinking process, that’s not what I’m referring to. (And I don’t do it.) My guess is that true doodling keeps the creative side of the brain profitably occupied or stimulated, while the cognitive side is trying to listen to the lecture or discussion and comprehend in its own linear way. But it’s truly liberating to take the doodling side of the brain and convert it to profitably diagramming what’s going on in the meeting. And I don’t say that entirely tongue-in-cheek…I have found my diagrams totally useful, and others seem to appreciate having them after the meeting finishes.
PS: Yes, this is in large measure what our visual journalists and facilitators are doing when they help us with meetings and other processes. People like Eileen Clegg, who I’ve done a project with, and David Sibbet-trained people all around the world. See also Dan Roam’s Back of the Napkin blog for some fun ideas. But, as you can see, I wonder how great it would be if people were to throw away the scaffolding and do thier own visual documenting.
Leave a Reply