 This is more fun than any sporting event. The US Geological Survey long ago automated their earthquake reporting instruments and it has become somewhat of a sport to see how fast we can report the shaking intensity and other details following even the smallest seismic event. There was a small quake near AlumRock/San Jose/Morgan Hill about an hour ago and a couple thousand people went to a USGS web site to report the intensity – as they felt it – with many reports coming in within 10 minutes of the actual event (and 14,000 reports in an hour for this particular one).
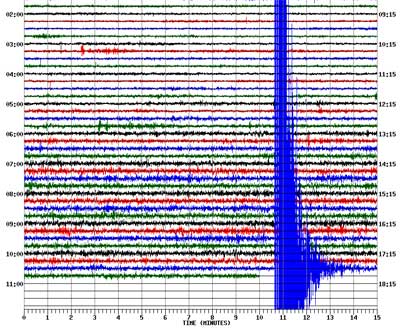
Read more about what the USGS has available online for earthquake reporting. Here’s what the event looked like on the seismograph at Stanford Telescope in the hills west of Stanford University (
![]() click this for full original recording of this quake). Just after 10:40 this morning a sudden whipping back and forth of the “needle” on the seismograph that settles down over the course of almost a full minute (each vertical black line on the seismogram represents a minute and the width of the graph represents 15 minutes). The needle is no longer physical – it’s solid-state electronics and it reads accelerometers or strain gauges. I only felt the quake for maybe 2 seconds, but it was quite definitely a quake. Robert Scoble and Howard Rheingold and others tweeted the quake with Robert reporting “must have been a 5.0” from Half Moon Bay. It was a 4.3 centered between Alum Rock and Morgan Hill (CA).
click this for full original recording of this quake). Just after 10:40 this morning a sudden whipping back and forth of the “needle” on the seismograph that settles down over the course of almost a full minute (each vertical black line on the seismogram represents a minute and the width of the graph represents 15 minutes). The needle is no longer physical – it’s solid-state electronics and it reads accelerometers or strain gauges. I only felt the quake for maybe 2 seconds, but it was quite definitely a quake. Robert Scoble and Howard Rheingold and others tweeted the quake with Robert reporting “must have been a 5.0” from Half Moon Bay. It was a 4.3 centered between Alum Rock and Morgan Hill (CA).
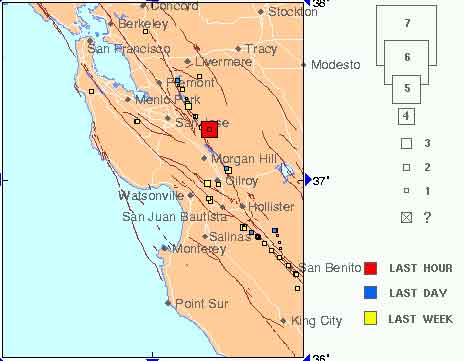
 Each quake is triangulated without human intervention (the magnitude of the event as “felt” by seismographs at 3 or more locations is measured and the location is calculated by computer) and put instantly on a CA map (right). Smaller quakes don’t require any special attention, but larger quakes are reviewed by professionals and verified within a few minutes. The magnitude is calculated and revised over time. A square appears (immediately after the quake) on the map showing where the shake occurred. For this quake the square is red (happened in the last hour) and is sized to represent a magnitude 4 quake. You can see it southeast of the Bay Area on the map. For each quake they post a “Did you feel it?” page that allows everyone to report the intensity and duration of the quake, and any damage it may have caused. A scale from I to X (1 to 10) represents the intensity and damage. To report your experience of the quake, you input your zip code and answer questions about what happened – the duration, your reaction, and the damage (none in this case). From this, they calculate the intensity at your location. Here in San Francisco it was intensity II which is “weak” and there was no damage.
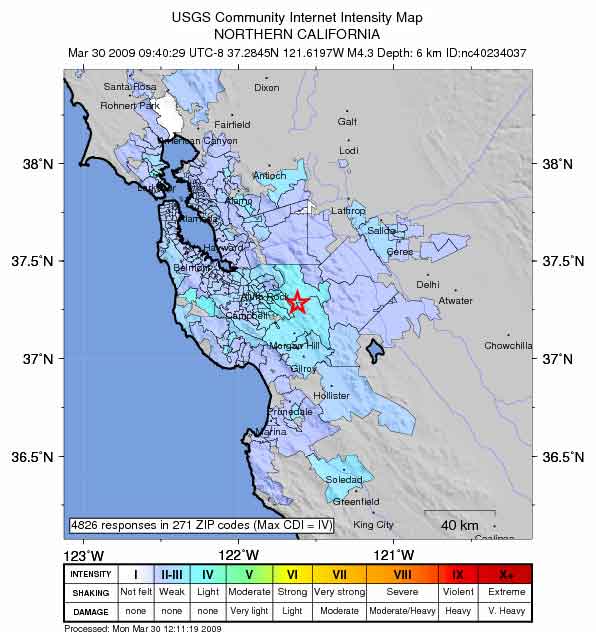
 Then a map is assembled (again, by computers) showing (with color) the intensity as felt by those who reported the quake. The map shows zip code area outlines and colors them to represent the reported intensity. (Click the map to see an original.) If you look at the map for this particular quake you’ll see that the shock was felt mostly northwest and southeast along the major fault lines in our area. A friend in Santa Cruz on the coast reported to me that he didn’t feel the quake at all.
In case you non-Californians are wondering, a quake this size may not even make the TV news. It’s strong enough to be felt, but causes no damage. They occur maybe several times a month if you consider the state as a whole.
As I was out hiking yesterday I was thinking it has been just about 20 years now since the Loma Prieta quake of 1989. We have a quake that you can feel maybe once or twice a year, but so far nothing even alarming for 20 years.
Leave a Reply